Obol Launches Fleet-to-Node Monitoring Dashboard
Obol unveils our new fleet-to-node monitoring dashboard, which lets our partners monitor their fleet and access all the details they need through one intuitive interface.
The fleet-to-node monitoring dashboard is live in production now. Partners can use it to monitor their entire fleet and dig into the granular details as needed.
Introducing the Fleet-to-Node Monitoring Dashboard
Obol has revamped our monitoring dashboard for our largest partners. The new fleet-to-node monitoring dashboard gives partners a clear overview of their full fleet with the option to look into individual clusters and nodes through one simple interface. Plus, the updated dashboard tracks several new metrics.
Track your entire fleet from a single dashboard then dig into the granular details whenever you need.
The new dashboard is designed with the owner’s workflow and roles in mind, offering optimizations for specific tasks and an intuitive monitoring experience. Operators can access three views through the dashboard:
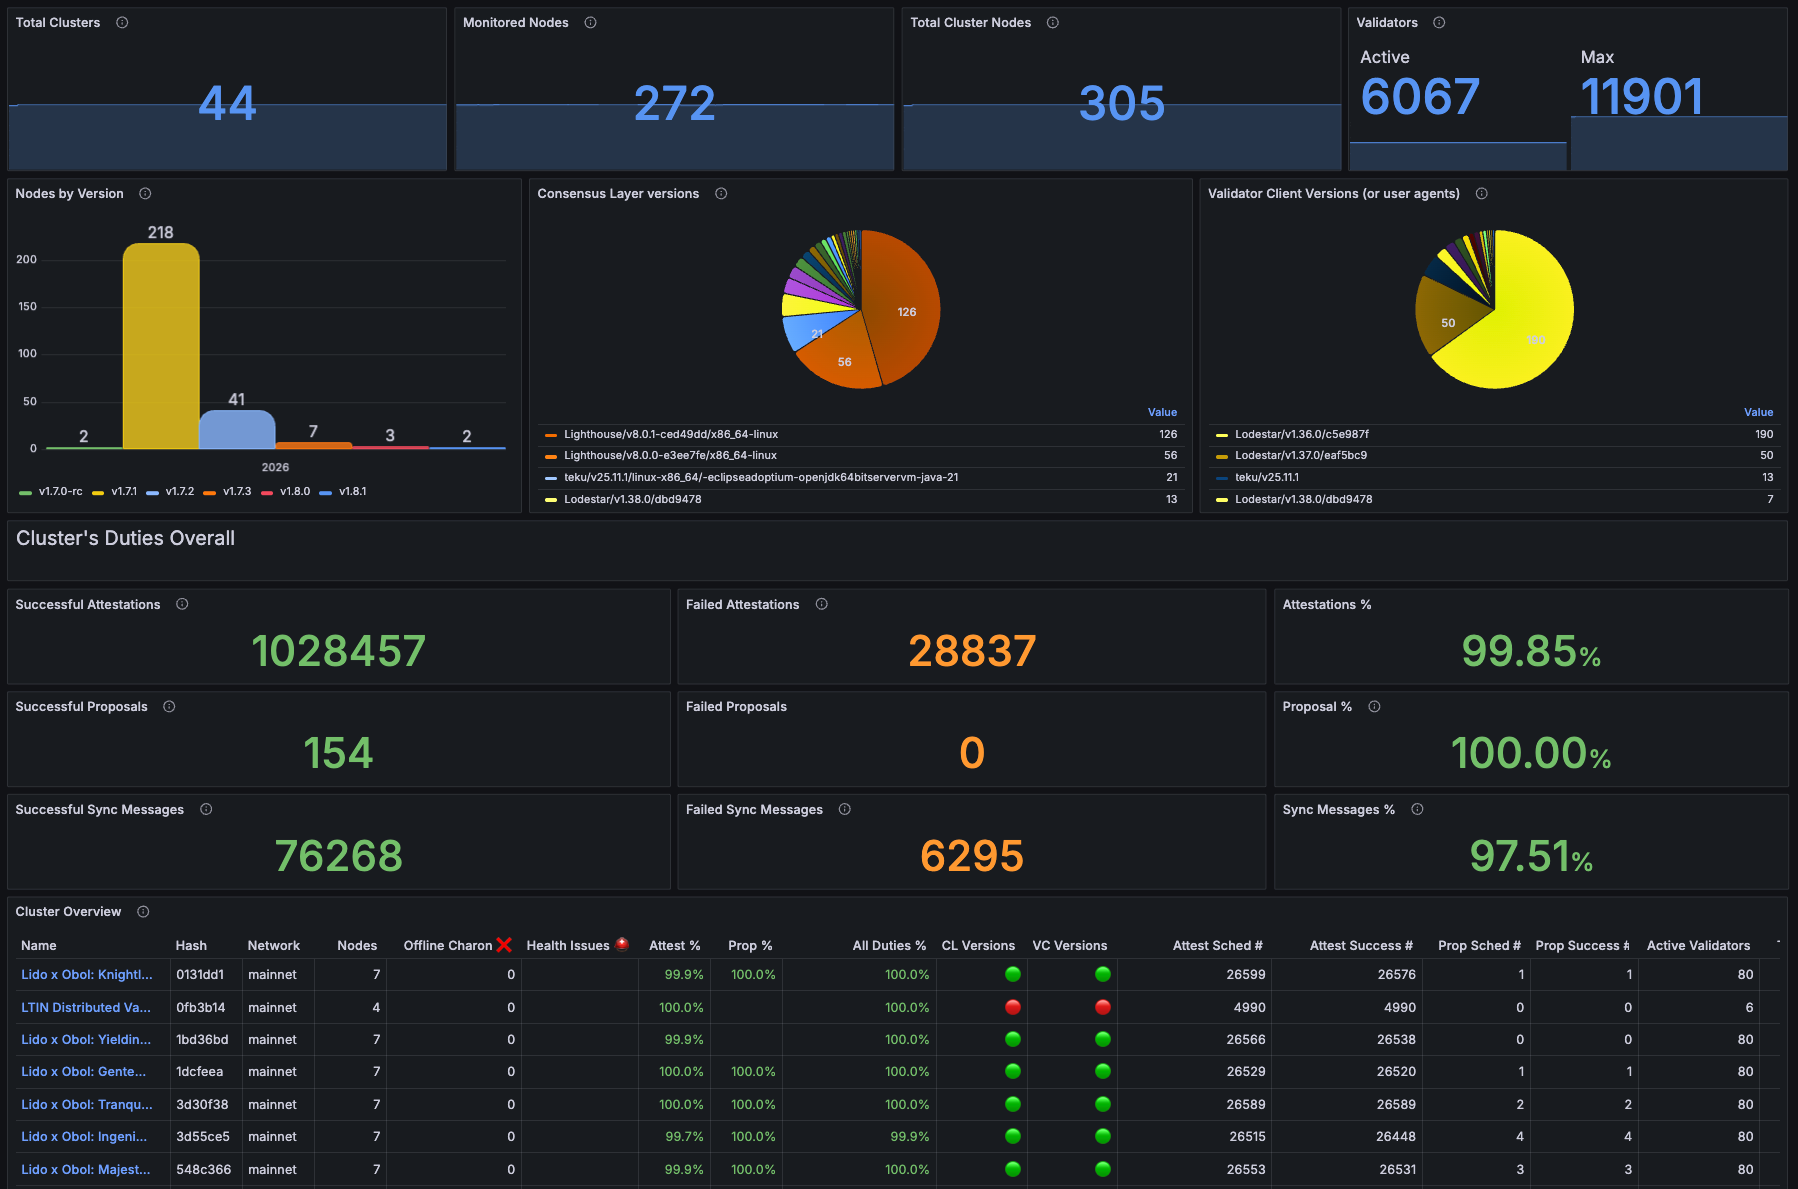
Fleet View - offers a high-level overview of all clusters in the owner’s network. The Fleet View displays health status indicators for each cluster, aggregate metrics, performance trends, and more.
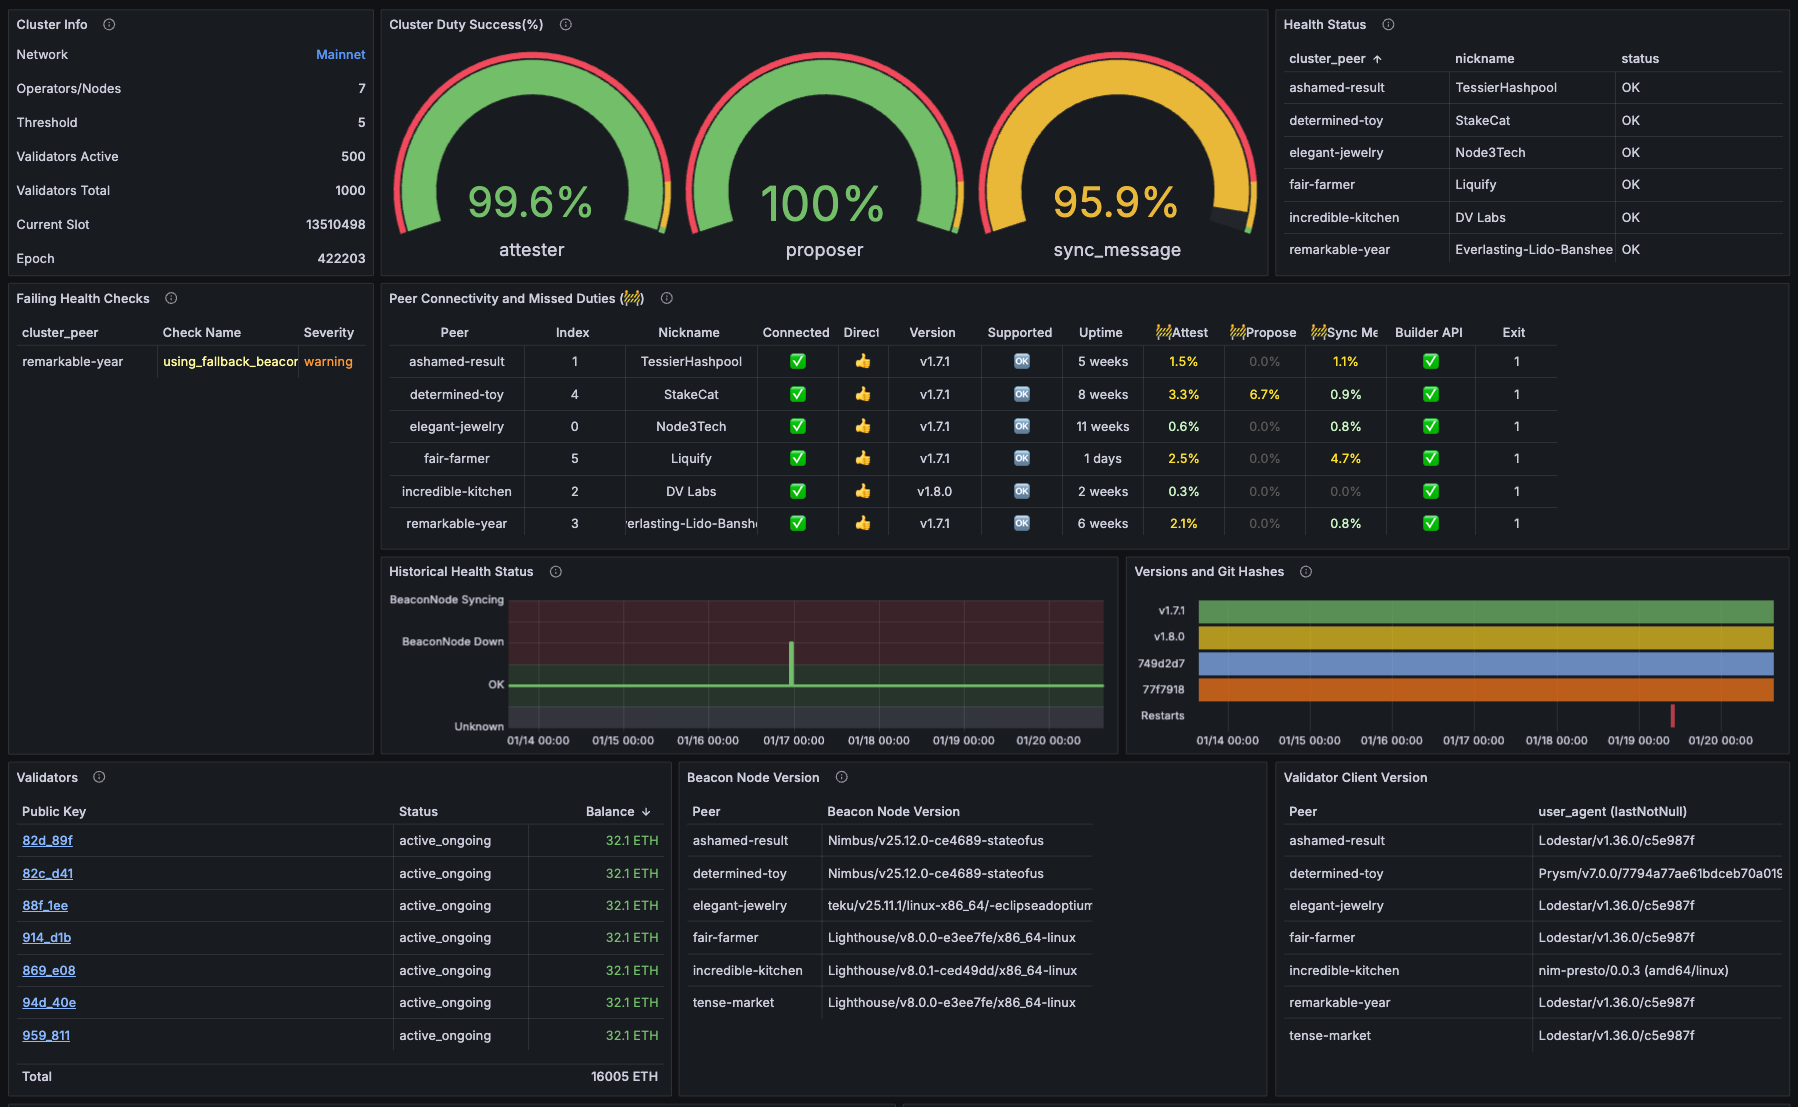
Cluster View - offers full diagnostics of individual clusters. The Cluster View shows the health status for all peers in the cluster, attestation, proposal and sync message tracking per peer, peer-to-peer connectivity and latency metrics, and more.
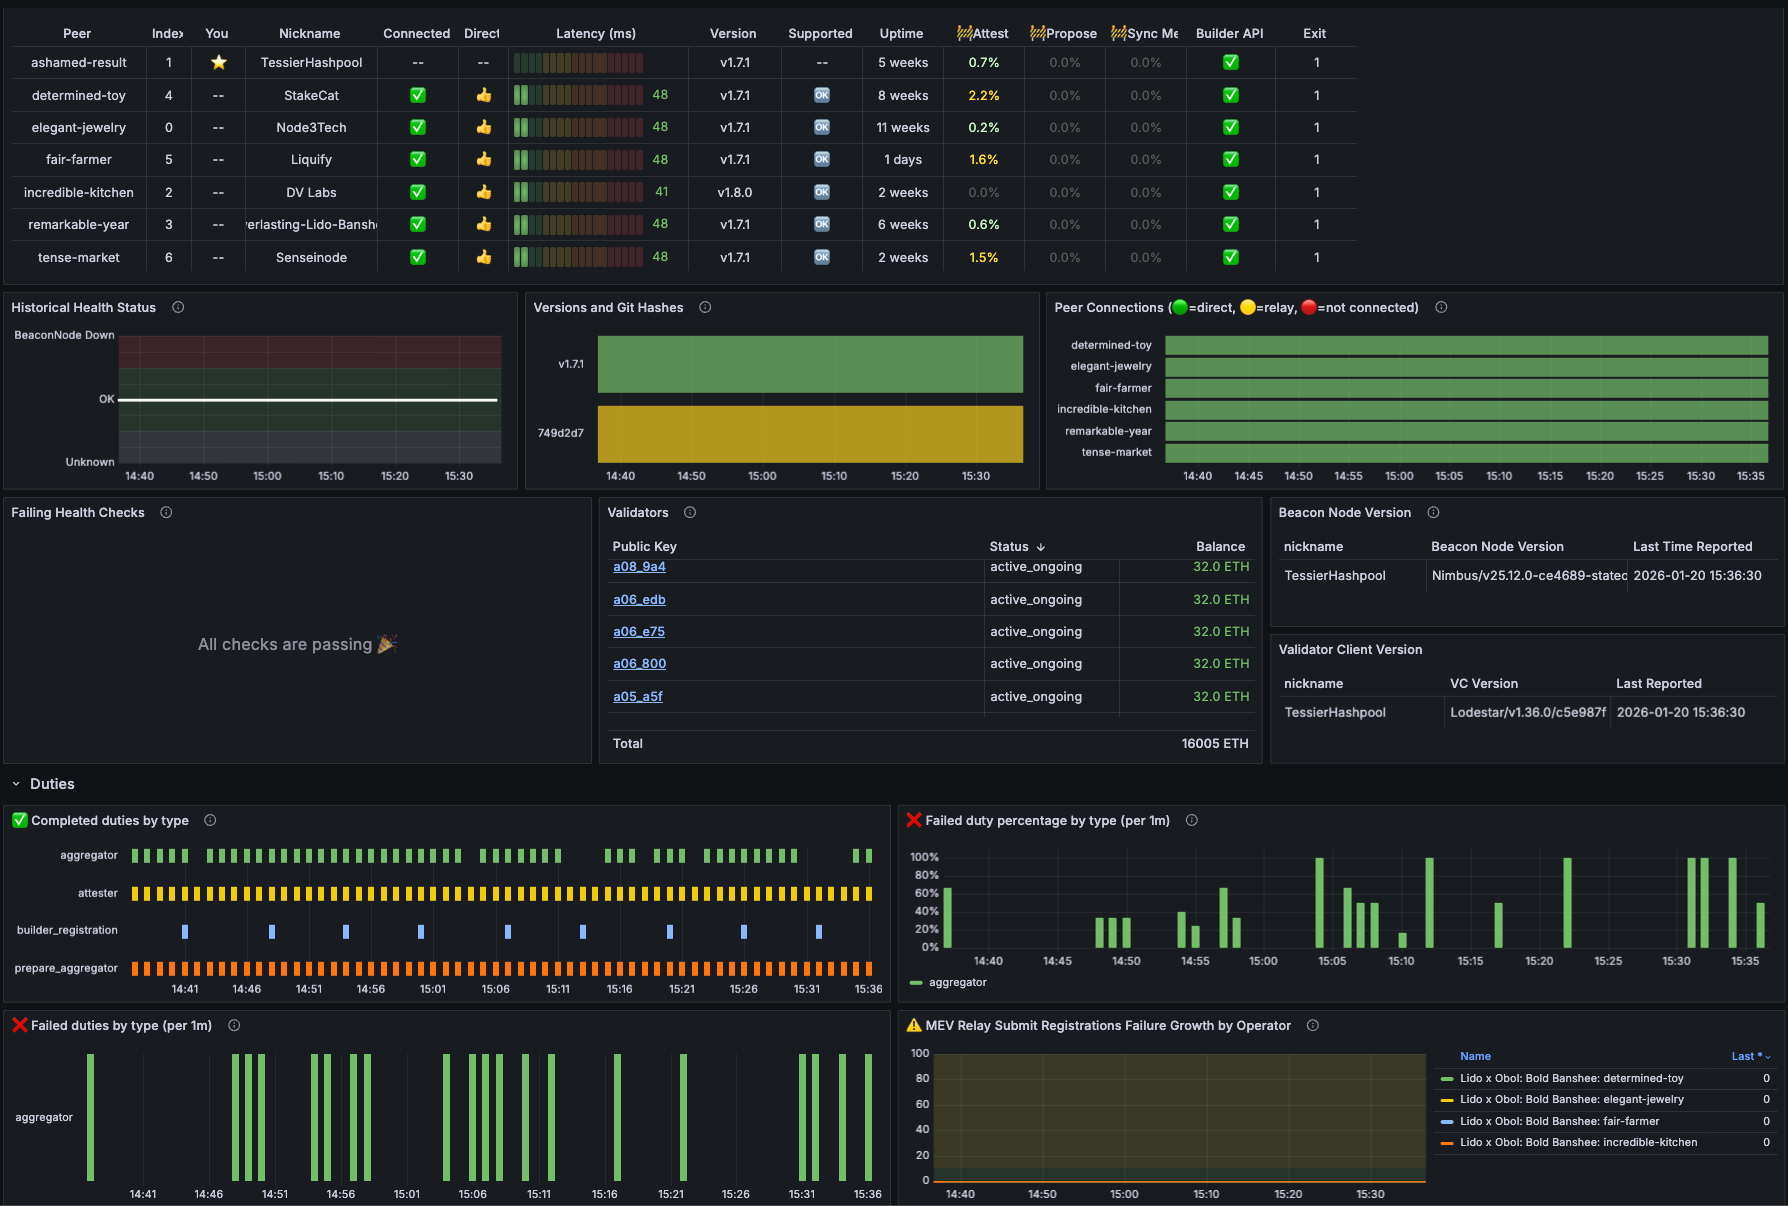
Node View - offers a health check for a single node within a cluster. The Node View is useful for setup and operation as it offers a focused view of the node’s health in two modes (the simple User mode, and a more detailed Dev mode).
New Metric Tracking
The dashboard is designed such that users can get a succinct overview in the Fleet View. If any issues are flagged in red, they can then hone into the Cluster View to find out the cause.
The new metrics also give users useful context for evaluating their performance. They are as follows:
Percentage of blocks processed by beacon node client within four seconds - this is useful because blocks received earlier in a slot are more likely to attest correctly, allowing operators to migrate to fast clients promptly as needed. Accessible via the Fleet View.
Client diversity indicators across consensus and execution layer - operators should be able to track client diversity because it enables the endgame staking configuration, offering protection from isolated client bugs. Operators can switch clients if they see that more than ⅓ of the nodes are using it. Accessible via the Fleet View.
Health status drill-down table - this feature lets operators identify the problematic peer and then directly click into the Node View to access the full diagnostics. Accessible via the Cluster View.
A Better Monitoring Experience
Our old dashboard was information-dense and issues were difficult to identify. With three purpose-built views, user journey optimizations, and new metrics to boot, the fleet-to-node monitoring dashboard offers operators a better, more intuitive monitoring experience.
Operators get better visibility, intelligent flagging, and efficient troubleshooting, meaning they can more easily improve their fleet’s performance. Lido and ether.fi, two of the staking ecosystem’s most sophisticated entities, have begun using Fleet View and can attest to the improvements.
“Multi-operator DVs have built-in enhanced resilience, ensuring a validator continues to operate even if an individual node experiences issues that don’t immediately show up in traditional monitoring. This makes early visibility especially important. Lido Node Operator contributors use Fleet View daily to surface potential problems early, so Simple DVT operators can address them before performance is impacted.”—Remus, Lido Labs Foundation
We are ready to create the new dashboard’s Fleet View for partners managing a fleet of clusters now. Reach out to our team to learn more.